Attaching the debugger to your webservice
I asked my colleague and our ASP.NET expert Alex Thissen how I could solve a problem I had for some time. I have a Windows Form application and a ASMX 2.0 project in the same solution. Whenever I start the debugger to step through some code, I have to attach the debugger to the webserver that’s running my webservice. This can be quite annoying, when you have to do this dozens of times a day. Alex had the solution, and was surprised I didn’t know this already. Fact is however, I asked a lot of people about this in the last few days, but no one knew the answer. So although I’m not the only one to not know this (until now), you might be as surprised as Alex was. 😉
The solution is to set both the Windows Forms application as the webservice as a startup project. Right-click your solution and you’ll be presented with the following menu.
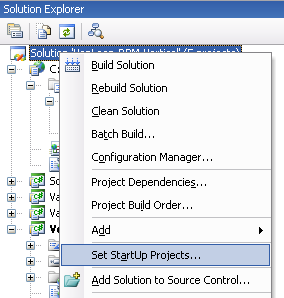
Now click the highlighted option and you’ll be presented with a dialog window. In it, you can setup the multiple startup projects, as shown in the image below.
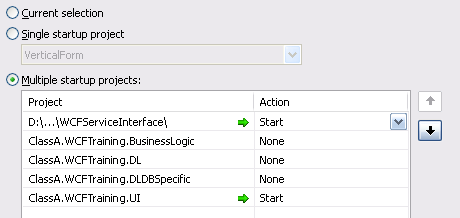
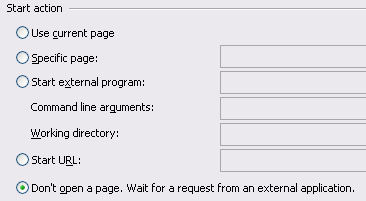
I’ve added two green arrows to show you exactly the projects I’ve set as startup projects. Once you close this dialog window, you’ll see the solution is now bold, instead of just one project. Now the debugger will automatically attach itself to both projects. It will also launch the default webbrowser however (of course Internet Explorer) which you’ll have to turn off. Go to the project property pages of your webservice, and select the “Start options” in the list on the left. You’ll be presented with the following options, of which you’ll have to set the “Don’t open a page”, as shown in the image below.
That’s it, happy debugging!